Receiving data at the Ethernet 10BASE-T PHY layer
In last month's post, part of a series on my Niccle project, I talked about transmitting outgoing data at the Ethernet 10BASE-T PHY layer. In this post I'll talk about the other responsibility of the PHY layer: receiving incoming data. I recently added this functionality to the Niccle project in commit 1af91e3.
Table of Contents
Implementing the receive loop
At a high level the RX implementation follows a similar approach as the TX implementation in my previous post did: when an incoming packet arrives it triggers a GPIO interrupt, which in turn invokes a packet-receiving loop which is again handwritten in assembly code, using the ESP32-C6 chip's dedicated IO feature.
However, It turns out that writing a receive loop is a bit more challenging than it is to write an outgoing transmission loop, like I did in the last post.
-
As the receiver, we don't control the timing of the signal. Packets may arrive at any time, and have to align with the sender's chosen timing. This is different than on the TX side, where we control when we choose to transmit a packet, and where we can just start sending data at any time as long as we ensure that the emit a valid signal.
On the RX side we must use an approach that starts sampling at just the right point in time and that samples at just the right frequency, in order to be able to reconstruct the data signal.
-
Receiving incoming data involves a few more steps, compared to transmitting outgoing data. When we're transmitting outgoing data, we simply have to load the next byte of data, output 8 bit symbols, check if there are more bytes of data, and repeat.
When receiving data, we must sample at the right frequency, and store sampled data into a memory buffer. This is similar to the outgoing transmission steps. But between sampling the signal we must also check whether the end of the transmission has been reached (e.g. by detecting the TP_IDL signal), and ideally we should also Manchester-decode the incoming data as we receive it to avoid the need for a separate decoding step.
-
Since the GPIO interrupt will fire whenever a signal edge is detected, it will also fire whenever an incoming link test pulse (LTP) is received. We need to distinguish these LTPs from actual incoming data transmissions, and ideally do so as quickly as possible to avoid wasting unnecessary CPU cycle inside the interrupt routine.
-
Lastly, after we think we've received some packet data, we must check whether the data is actually valid or not, and before we do that we must first find actual start of the frame data within the received data stream. These are technically the MAC layer's responsibility, but if we can't validate checksums, then we can't know whether the PHY layer was implemented correctly, so we have to tackle this problem at the same time as the rest of the PHY implementation.
After a bunch of prototyping and trying different approaches, I ended up separating the problem into the following concerns:
-
Ensuring we can handle incoming packets at any time, regardless of what may be going on in the main thread of execution.
-
Separating link test pulses from actual data transmissions.
-
Determining the point at which we should start sampling packet data.
-
Sampling data at a consistent rate, and determining when we should stop sampling.
-
Implementing a basic MAC layer that can perform data alignment and checksum validation.
Each of these concerns can be handled by fairly separately in the implementation, and I'll discuss each of them in sequence in the following sections.
Using an interrupt to trigger the receive loop
The first concern can be solved by using an edge-triggered interrupt on the RX GPIO pin. This interrupt will fire whenever an incoming signal edge arrives at the pin. This will allow us to receive packets at any time (as long interrupts aren't disabled by some other code), and will allow us to continue to leave the main thread of execution available for whatever business logic you'd want to run there.
The Ethernet 10BASE-T specification dictates that every packet starts with a 5600 ns long preamble signal (see my previous overview of Ethernet 10BASE-T). As long as the interrupt routine (and therefore our receive loop) is invoked before that preamble signal has passed by, we should be able to receive the packet successfully. If we fail to start sampling before the end of the preamble signal, then we have no way to determine where the frame data starts, and the packet will be lost.
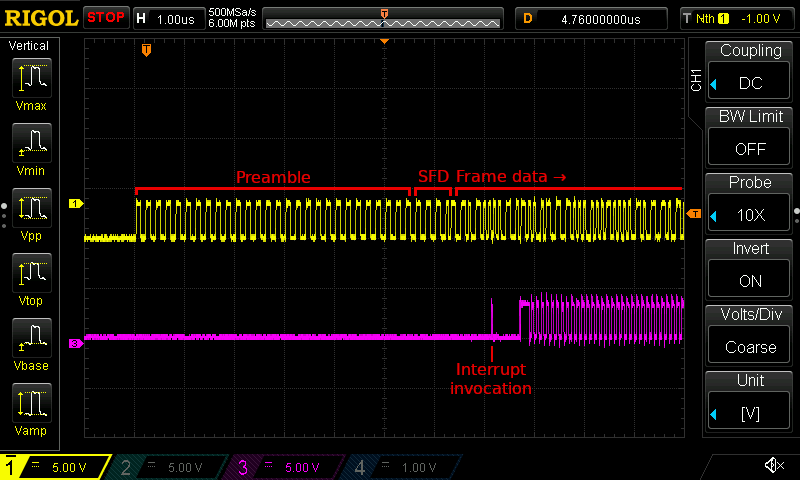
It turns out that in the default configuration of the esp-rs/esp-hal framework, the latency between an interrupt firing and the corresponding interrupt routine being invoked is indeed too high. With the latest published version of the framework at the time of writing, I observed a latency of about 7100 ns between the first data signal edge, and the first instruction of the interrupt routine being invoked. The framework implements a fairly elaborate and flexible interrupt dispatching mechanism, which means that quite a bit of code has to run just to determine which interrupt routine to invoke, and this ends up taking too long.
You can see this in the screenshot below, which shows the incoming packet signal as well as a debug signal (more on this below) that is emitted by the receive loop implementation. The first edge in the debug signal indicates the point at which the interrupt routine's code started executing. Note how by the time the interrupt routine starts executing, the steady 5 MHz preamble signal has long passed by already.

Two oscilloscopes trace showing the start of an incoming packet transmission (the yellow trace at the top), as well as a debug signal (the purple trace at the bottom). Note there is about 7100 ns between the first edge in the packet signal and the first pulse in the debug signal, which reflects the time at which the interrupt routine is invoked. As highlighted, the preamble has already passed by at that point.
Luckily, the esp-rs/esp-hal framework recently added support for an alternate
way of handling interrupts (see
pull request #621), enabled by the
direct-vectoring feature. When using this alternate implementation the
framework's APIs become a bit less flexible and cumbersome to use, but as a
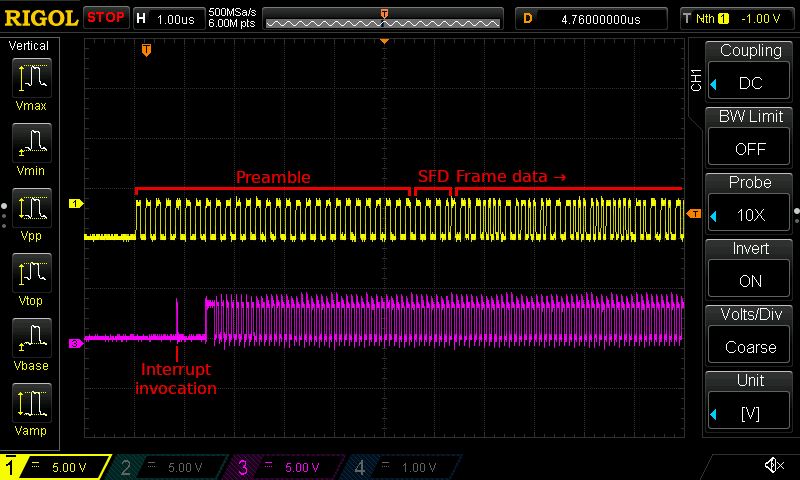
result the interrupt latency drops down to just 750 ns or so.
You can see this in action in the screenshot below. Note how the interrupt routine now starts executing way before the preamble signal has finished, given us plenty of time to start sampling the data.

Two oscilloscope traces showing the start of an incoming packet transmission (the yellow trace at the top), as well as a debug signal (the purple trace at the bottom). Note that there is now a much shorter gap of about 750 ns between the first signal edge and the interrupt routine invocation. As highlighted, there is plenty of preamble signal left to be sampled at that point.
Now all we have to do each time the interrupt routine is invoked is to try and receive some packet data, and if we think a packet has actually been received, hand it off to a MAC layer for further processing.
The fact that we invoke the receive loop from within an interrupt routine does mean that we'll need to block the routine for up to 1,221 μs at a time (in case of a maximum-sized packet). That's still just a bit more than a millisecond, however, and there's really no way around this given that we're using a bit-banged, CPU-driven implementation to receive packets.
Detecting link test pulses
The interrupt routine will be woken up not just for incoming packets, but also for each incoming link test pulse (LTP). Ideally we should return from the interrupt routine as soon as possible whenever the reason for the interrupt is an LTP, to avoid wasting precious CPU cycles every 16 ms.
Luckily, detecting LTPs is quite easy. Since it takes at least 750 ns before our
interrupt routine is actually invoked, the LTP signal will already have come and
gone by the time our code runs. This means that the line will generally have
returned to idle by the time we start sampling it, and hence that all of our
samples would return a 0 value.
Therefore, all we have to do to separate an LTP interrupt from a data interrupt is to check whether the line consistently reads zero. If it does so for more than 100 ns, we know that we must have been woken up by an LTP, because the Manchester encoding guarantees that a data packet signal would never have a sequence of zero signal for more than 100 ns at a time.
Determining when to start sampling
Now that we know how to filter out LTP signal, we can move on to sampling the data signals.
I arrived at an approach where I sample the incoming data signal at a frequency of 20 MHz, i.e. one sample every 50 ns. Ethernet 10BASE-T signals have a maximum signal bandwidth of 10 MHz, and the Nyquist-Shannon sampling theorem, tells us that as long as we sample this signal at a frequency of 20 MHz or higher, we should be able to fully reconstruct it.
However, in practice we do still have to be careful about when we take each sample. We ideally should sample somewhere in the middle of each bit symbol half. This ensures that if the signal has some jitter in it (e.g. in case the sender doesn't fully adhere to the 100 ns per bit symbol requirement), our sample points will still be far enough away from the signal edges at the start/end of each bit symbol half.
In order to make it easier to perform Manchester decoding as the data is received, it would also be best if we can ensure that we consistently start the sampling process at the first half of a bit symbol. That way we can assume that every second sampled bit corresponds to the decoded data bit, since a property of Ethernet's Manchester encoding is that each second bit symbol half matches the unencoded data signal.
We can achieve both of those goals as follows:
-
Once we've determined that the signal is not consistently zero (i.e. once we've sampled at least one
1bit), wait in a tight loop until we see a0bit again. -
Once we see a
0bit, we know that a falling edge must have just occurred. If we assume that that edge is part of the 5 MHz preamble signal, then we can also assume that we're currently in the process of receiving the second half of a preamble bit symbol. -
Therefore, we should start sampling the data approximately 75 ns from when we saw that falling edge. Since each bit symbol half is 50 ns long, that 75 ns offset would place us in the middle of the next bit symbol half, which we know must be the first half of a bit symbol.

An illustration of the sampling approach described above. Note how starting the sampling process 75 ns from the detected falling edge ensures that we'll start sampling in the middle of the next bit symbol's first half.
This is somewhat akin to a software implementation of a phase-locked loop (PLL) works: detecting an edge in an input clock signal (the preamble in this case) and then trying to align its own clock phase to the input clock phase.
Sampling data, and determining when to stop
From that point on we should sample the data signal consistently every 50 ns, and as we're sampling the data we should store every other sample for later consumption (this is the Manchester-decoded data signal). In my implementation each loop iteration samples a sequence of 8 bit symbols, performing 16 samples in total, and then stores one byte of decoded data into an output buffer.
In order to determine if the end of the signal has been reached, we should also inspect the sequence of samples as we go. In Ethernet 10BASE-T the TP_IDL signal indicates the end of a data frame, and it consists of at least 250 ns of positive signal on the line. We also know that any valid Manchester-encoded data stream will contain at most 100 ns of consecutive positive values on the line, since the encoding ensures a signal transition occurs at least once every 100 ns.
Therefore, if we sample three consecutive 1 values on the line, we can assume
that the line has been positive for at least 150 ns, and hence we can assume that
we've hit the TP_IDL part of the transmission. Similarly, if we ever see three
consecutive 0 values on the line, we can also assume that the transmission has
ended (perhaps because it was truncated by the sender, or because our receive
loop was interrupted). In both cases, we should break out of the receive loop.
Since ESP32-C6 chip's CPU is set to its maximum clock speed of 160 MHz, we must perform two samples every 16 CPU cycles (each 8 cycles apart), and we must fit all of the above steps within the remaining 14 CPU cycles. This is a tight squeeze, but it is doable, as long as we carefully count the number of CPU cycles each instruction will take, and as long as we are careful to place certain alignment-sensitive instructions at 4 byte-aligned addresses (see my previous post on counting CPU cycle for more info).
Outputting a debug signal
Because the timing of the receive loop is so sensitive, and because there are so many steps involved, I ended up interspersing the receive loop implementation with some auxiliary instructions that output a debug signal to an additional output GPIO pin.
Since we use the dedicated IO feature of the ESP32-C6 chip, these debug instructions only take a single CPU cycle, and hence they're easy enough to fit into the receive loop without using up the very limited budget of CPU cycles we have.
The debug signal is updated at key points in the receive loop implementation, to help us monitor the loop's behavior:
-
At the very beginning of the interrupt routine: this allows us to gauge the latency between the interrupt firing and the interrupt routine being invoked. In fact, it's this signal that is shown in the screenshots in the section discussing the interrupt routine, above.
-
At the very start of the receive loop: this allows us to gauge the latency between the interrupt routine being invoked and the assembly code of the receive loop being executed (e.g. due to synchronization or function call overhead).
-
Once a falling edge is detected: this allows us to gauge, approximately, the point at which the receive loop will start sampling data (~75 ns from when it thinks the falling edge occurred).
-
After every sample: this allow us to confirm that the sampling indeed happens at a steady 20 MHz frequency, each sample 50 ns apart. This is a key point where it can easily go wrong, e.g. if an instruction is misaligned and unexpectedly takes an extra CPU cycle.
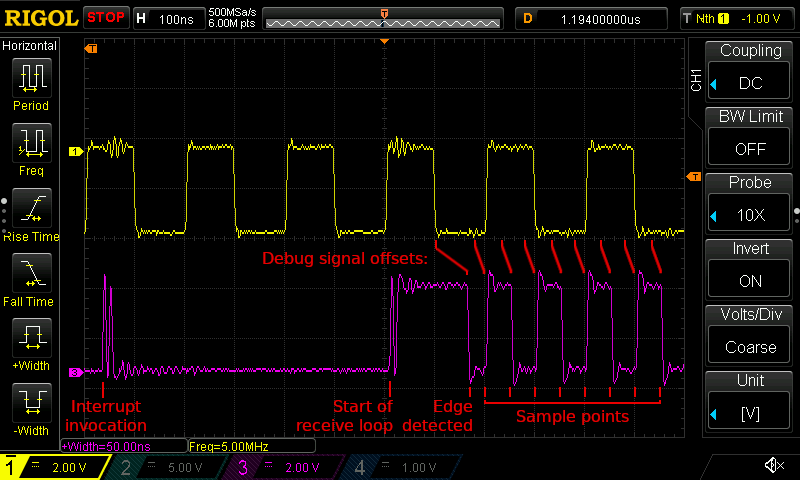
The screenshot below shows the debug signal in action at the start of an incoming transmission, and it includes all four of the points in the list above.

Two oscilloscope traces showing the start of an incoming packet transmission (the yellow trace at the top), as well as the debug signal (the purple trace at the bottom). Note that the falling edge and sample point debug signals are emitted some number of cycles after their corresponding events actually occurred. As long as we take these predictable offsets into account, we can use the debug signal to gauge the points at which each sample was taken.
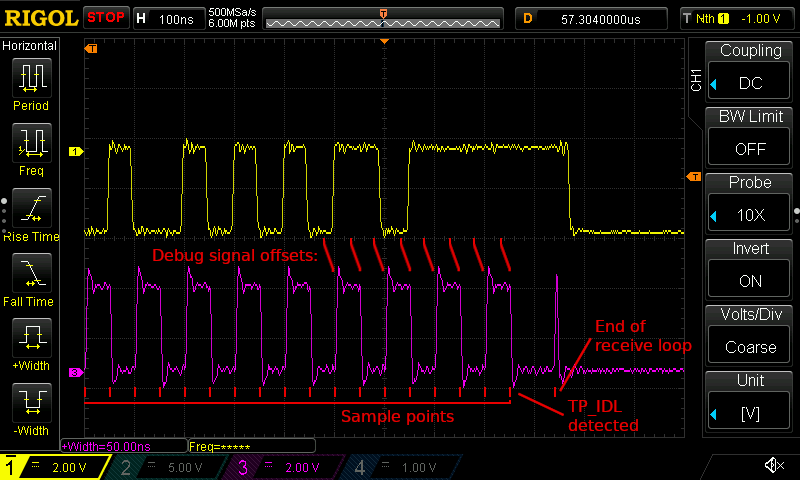
The next screenshot show the end of an incoming transmission:

Two oscilloscope traces showing the end of an incoming packet transmission (the yellow trace at the top), as well as the debug signal (the purple trace at the bottom). Note how the sampling points are still exactly 50 ns apart, and how they still fall near the middle of each bit symbol half, far enough away from the signal edges.
I found this type of debug signal to be a critical tool for making my implementation work, as it allowed me to pinpoint numerous timing-related issues. Because it was so useful I left all of the debug signal instructions in the code I published to the repository. This should hopefully make it easier to land future improvements to the code.
Implementing basic MAC packet validation
If we did everything correctly, we should now have a functional PHY layer which will for each incoming data packet produce an output buffer containing the Manchester-decoded packet data. However, this data will still be unaligned.
For example, the buffer returned by the PHY might looks as follows when shown in network bit order, i.e. the most significant bit of each byte having been received first:
10101010 10101101 00100000 10110001 10101000
The buffer shows a bit of preamble signal (101010), followed by the Start
Frame Delimiter (SFD) sequence (10101011). However, in this example the SFD
sequence spans two bytes (i.e. it isn't aligned to the byte boundaries). The
actual frame data follows the SFD sequence. For the above example, the aligned
frame data would be:
01001000 00101100 01101010 00...
Only once we've isolated the frame data within the bit stream returned by the PHY can we validate the data for correctness, using the frame check sequence (FCS).
As I discussed in my previous overview of Ethernet 10BASE-T, data alignment and correctness checks are both MAC layer responsibilities. However, while this post mainly focuses on the PHY layer implementation, we can't really validate that PHY implementation without also implementing a very basic version of these MAC layer checks. So in the same commit where I implemented the PHY layer, I also included a very basic MAC layer.
This MAC layer currently performs the following few steps:
-
First, it tries to find the Start Frame Delimiter (SFD) sequence within the data returned by the PHY layer.1
-
If the SFD is found, then it and all of the preamble data preceding it are stripped from the buffer, thereby aligning the frame data to the beginning of the buffer.
-
The MAC implementation then calculates the checksum2 over the frame data (all of the bytes in the buffer minus the last four), and compares it with the received FCS value (the last four bytes in the buffer). The packet is considered valid if the calculated checksum value matches the received FCS value.
At the end of these steps, the implementation logs some diagnostic information to the serial output, indicating whether a valid frame was received. This is enough to let us validate the PHY implementation.
The snippet below shows the output from the
arp_request
example binary, after letting it run for multiple hours:
INFO - Booted up!
...
INFO - ----------
INFO - LTPs sent: 18
INFO - LTPs received: 18
INFO - Packets sent: 0
INFO - Probable packets received: 0
INFO - Truncated (invalid) packets received: 0
INFO - <<< RX 114 bytes, CRC ok (calculated: 82CD9471, received: 82CD9471),
dst 33:33:00:00:00:16, src E0:4 F:43:E6:F8:CA, type 0x86DD
INFO - <<< RX 219 bytes, CRC ok (calculated: EE5C9178, received: EE5C9178),
dst 01:00:5E:7 F:FF:FA, src E0:4 F:43:E6:F8:CA, type 0x0800
INFO - ----------
INFO - LTPs sent: 147
INFO - LTPs received: 137
INFO - Packets sent: 1
INFO - Probable packets received: 4
INFO - Truncated (invalid) packets received: 0
INFO - <<< RX 64 bytes, CRC ok (calculated: 787D262F, received: 787D262F),
dst 12:34:56:78:90:12, src E0:4 F:43:E6:F8:CA, type 0x0806
...
INFO - ----------
INFO - LTPs sent: 4686560
INFO - LTPs received: 4390464
INFO - Packets sent: 36891
INFO - Probable packets received: 39512
INFO - Truncated (invalid) packets received: 0
INFO - <<< RX 64 bytes, CRC ok (calculated: 787D262F, received: 787D262F),
dst 12:34:56:78:90:12, src E0:4 F:43:E6:F8:CA, type 0x0806
An excerpt of the output from the arp_request example binary. Lines starting
with <<< RX are printed by the MAC implementation, and indicate an incoming
packet.
We can see that the binary successfully receives a few different types of packets and that all of their checksums match. The PHY implementation must therefore be working correctly (at least some portion of the time)!
We see some incoming IPv4 and IPv6 multicast packets immediately after the link is brought online (these are emitted by my desktop as soon as a connection is detected). After that, as the binary emits an outgoing ARP request packet every two seconds, we can see a steady stream of incoming ARP packets in response.
We can also see that the PHY layer classified a large number of wakeups as incoming LTPs. The number of received LTPs more or less matches the number of sent LTPs, which is in line with expectations.
Conclusion
We've now got a pretty much fully-functioning PHY layer implementation! The PHY implementation allows us to transmit data at any time, and can now receive data as well, whether that incoming data it is in response to one of our outgoing packets or not.
You can find the code for this post in commit 1af91e3 in the Niccle project repository. It has room for improvement in a number of places, but it gets the job done and can be optimized further at a later point.
The next step will be to complete the MAC layer implementation, and to layer a TCP/IP implementation on top of that. Check back soon!
Footnotes
The bitvec crate made the task of finding the SFD sequence in the bit stream very easy.
I used the crc32fast crate to perform the checksum calculations.